


 Understanding the spatial distribution of the stable water isotopes is important in several respects. A growing number of hydrological, forensic and ecological applications rely on "water isotope tracers" to determine the geospatial origin of water or geological or biological materials. Because the isotopic signal underlying this method is the spatial variation in stable isotopes in precipitation and environmental water, it is vital that we be able to accurately map the distribution of water isotopes worldwide. Most of our current understanding is drawn from a ~40 year data set maintained by the International Atomic Energy Association (IAEA) and World Meteorological Organization and containing stable hydrogen and oxygen isotope measurements from rainwater and snowfall collected at several hundred sites worldwide (IAEA/WMO, 2001). Although this collection of data includes tens of thousands of measurements for each isotope, the limited spatial and temporal coverage of the measurements limit their usefulness in regional and global studies. A method for accurately estimating the stable isotope composition of precipitation where data are not available could extend the usefulness of this data, especially if the quality of these estimates were known. Also, attempts to use stable isotope archive records to reconstruct climatic and meteorological regimes in the past assumes knowledge of how such regimes are represented in stable isotope fields in the modern. Especially where atmospheric circulation and vapor transport are at issue, these questions are spatial in nature. Accurate representation of the modern stable isotope fields will elucidate what we know about the relation between climate, meteorology, and the stable water isotope composition of precipitation and environmental water over a variety of timescales.
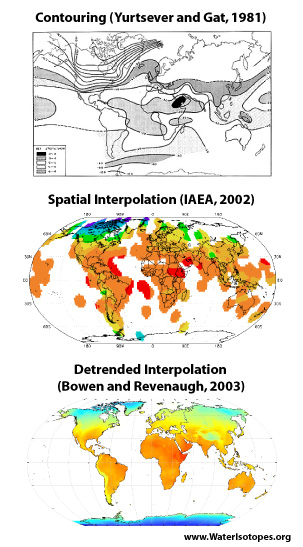
Early efforts to map the geospatial distribution of stable water isotopes in precipitation were undertaken for descriptive purposes and were based on simple contouring of data. Through time, more sophisticated spatial interpolation methods were applied to water isotope map-making and more detailed sets of maps were produced. The culmination of space-only water isotope mapping efforts is represented by a very comprehensive set of maps and animations produced by a group from the University of Waterloo in conjunction with the IAEA (IAEA, 2001). This group applied a complex spatial interpolation scheme designed in the 1950s for the representation of meteorological data to the GNIP data set in order to produce global and regional, annual and monthly average precipitation water isotope maps.
 The approach that our group uses, however, represents a major advance over these methods. First described in a paper in Geology (Bowen & Wilkinson, 2002), it is a member of a class of spatial estimation methods known as detrended interpolation. Its improvement over space-only methods derives from the use of additional, independent variables to describe predictable variation in water isotope ratios, meaning that the method only relies on spatial interpolation to represent effects for which the controlling variables are difficult to quantify. In practice, the method involves fitting parameters of an empirical model to stable isotope data using multiple regression, and applying the model to a global grid to produce first-pass estimates of water isotope compositions. A spatial interpolation method is then applied to the residuals of this model to create a second-pass model correction that accounts for regional isotopic variability not represented in the model.
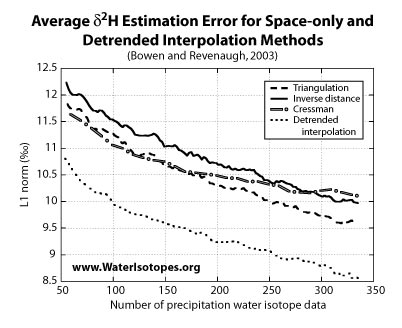
Further development of the "detrended interpolation" model, in collaboration with Justin Revenaugh, was presented in two parts at the fall 2002 GSA and AGU national meetings (GSA abstract; AGU abstract), and in manuscript published in Water Resources Research (Bowen & Revenaugh, 2003). In this work, we 1) refine the mathematics of the Bowen & Wilkinson (2002) model for the estimation of the stable isotope composition of precipitation, 2) find that this model reduces the average error of estimates by 10-20% relative to the other models tested, 3) develop a method for estimating the 95% confidence intervals of interpolated isotope point estimates, and 4) provide and interpret new maps of the estimated hydrogen and oxygen isotope composition and deuterium excess of precipitation and the confidence of these estimates. Figures from this paper can be downloaded here.
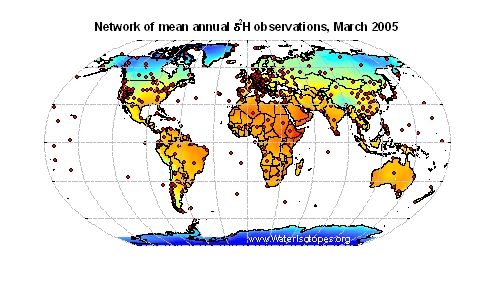 In 2004 I and my colleagues have made several important methodological advances in our geospatial water isotope modeling efforts. We have transitioned to conducting analyses and producing products using standard Geographic Information Systems (GIS) software (ArcGIS 9.0). This will provide an increased level of portability and accesiblity to our work. I have undertaken an effort to compile and include additional water isotope data from regional networks and the scientific literature in our analyses. This has lead to a ~25% increase in the number of annual average precipitation data available for our modeling efforts, and to an increase in coverage over geographic regions not well represented in the GNIP data set. It has also lead to new challenges...with the incorporation of large data sets representing from regional sampling networks the level of clustering in the data has increased to problematic levels, and for our current mapping efforts we have begun using Kriging, rather than inverse distance interpolation, of model residuals to better handle clustering.
We have also begun to explore the stable isotope composition of other pools of water. In a paper in Oecologia (Bowen et al., 2005) I describe methods for producing monthly average precipitation isotope maps. These allow estimation of the stable isotope ratios for water resources available at specific times of the year, such as water available to plants during their season of growth. Papers by Andrea Dutton (Dutton et al., 2005) and members ouf our research group (Bowen et al., 2011) have reported maps of surface (river) water isotope ratios for the United States. Ongoing work has focused on developing water isotope maps for tap water at scales ranging from countries to cities.