


From January 31 to February 4, 2011, an intense cold front and low pressure system moved across the central and eastern USA and Canada, bringing large accumulations of snow to many states. As the storm transited the region, approximately 50 scientist and citizen volunteers came together to collect more than 100 samples of precipitation. The samples were sent to the Purdue University Stable Isotope laboratory where they were analyzed for their stable H and O isotope ratios. The resulting data provide a tantalizing glimpse of "isotopic weather" - space and time-varying water isotope compositions that reflect patterns water sources that fed the system and the precipitation processes that lead to the intense accumulations of the Groundhog Day Storm.
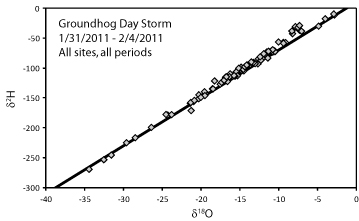
Hydrogen and oxygen isotope values for all samples demonstrate an enormous range of isotopic variation. Samples cluster about the global meteoric water (bold black line) line but show some systematic deviations, especially above the GMWL.
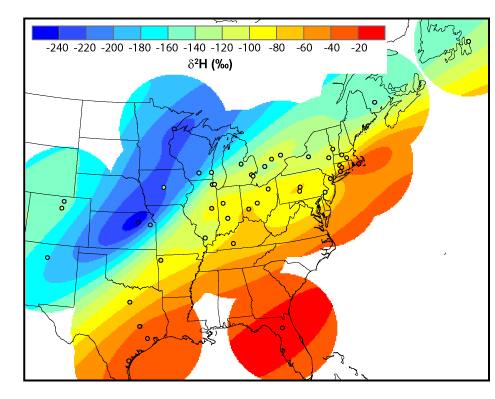
The hydrogen isotope ratios of storm water (averaged across all periods sampled) exhibit strong spatial variation, decreasing from the southeast to northwest and increasing again slightly to the west of the Great Plains. The overall pattern suggests strong moisture transport from the Gulf of Mexico and Atlantic to the northwest and intense distillation of moisture along this transport trajectory.
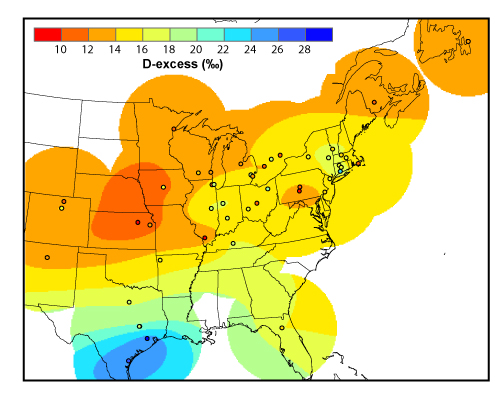
Deuterium excess values are calculated from the paired H and O isotope ratio values of storm water samples, and are indicative of the vapor sources contributing to the storm system. The most striking features of the D-excess distribution shown here (which reflects an average across all time periods sampled at each site) are the high values seen at some sites down-wind of the Great Lakes and the very high values observed in southern Texas. In both cases, the high values likely reflect the addition of water vapor to the atmosphere through evaporation from local water bodies (the Great Lakes and Gulf of Mexico).