

Sample record sheets and samples continue to roll in! Thanks to everyone who's been in touch with information on the storm, on the samples collected, or to express interest in the project. We should be starting analyses next Tuesday or Wednesday, with the initial results to follow a week or so thereafter.
We still have about 70 volunteers who we have not heard from. If/when you get a chance, please email us to either send in your sample record or let us know the status of your collection (even if this is just 'I wasn't able to collect samples'). We will start sending out individual reminders early next week if we haven't heard from you.
I hope everyone is doing well, and looking forward to seeing some results of this cooperative effort in the near future!
This morning's radar and forecast suggest only isolated rainfall parts of northwestern Pennsylvania, New York, and northern Vermont. If your are in this region, your local forecast calls for a significant chance of rain, and you are able to keep sampling, please go ahead and take another 12-hour sample or two for us. Otherwise, we will be contacting the rest of the group of known samplers this morning and officially drawing the sampling effort to a close.
If you have been collecting samples but have not yet exchanged emails with us, please take a moment to email and let us know you've been collecting. This would be a great time to email in your sample record sheet as well, this will contain all the information we need on your collections.
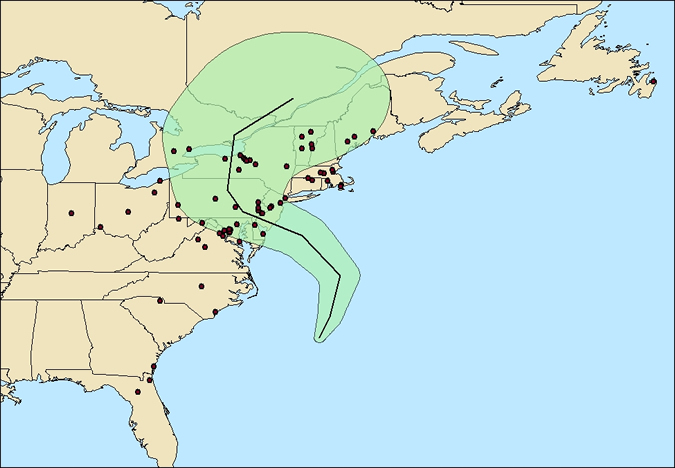
We continue to receive sample record sheets from across the study region...see the updated map below to check if we've logged yours! As of this morning we have received 30 record sheets listing more than 140 samples. We also received our first water samples in the mail yesterday!
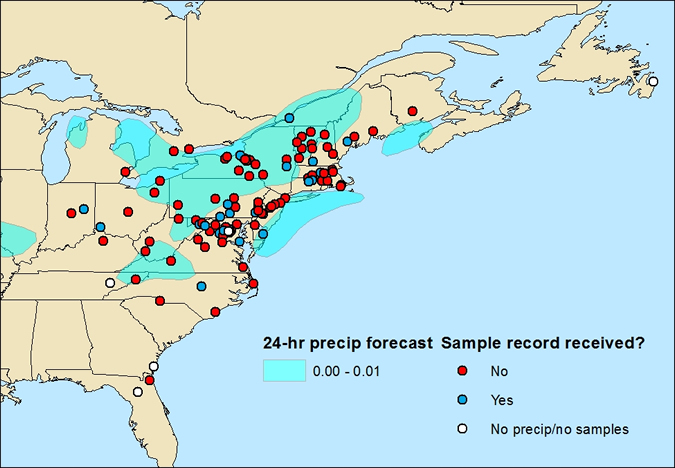
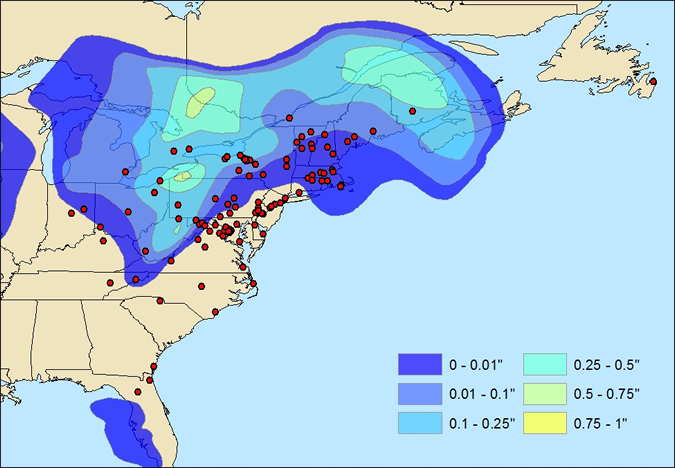
As November rolls in the last bits of the storm are rolling out of our study area. Regions from West Virginia to Canada and from Michigan to Maine are stil expected to receive some precipitation, but the amounts anticipated are getting smaller and the precipitating systems becoming less organized across the region.
This morning we will contact another group of volunteers with the go-ahead to send in samples. We anticipate that we will be contacting the rest of the network tomorrow and bringing sampling to a close.
Thank you to those of you who have sent in your sample record sheets and mailed your samples in response to our request yesterday. For several reasons it's important that we receive this information and the samples promptly once your sampling concludes. We will be planning over the coming days to ensure that we have the resources in place to rapidly process and analyze the large number of smaples we are expecting, and having your sample record sheets allows us to do this. The samples themselves, although not particularly volatile, can be affected by evaporation or (less likley) biological activity. Getting them into the lab promptly allows us to check the condition of the samples and take action to make sure they are preserved properly until they can be analyzed.
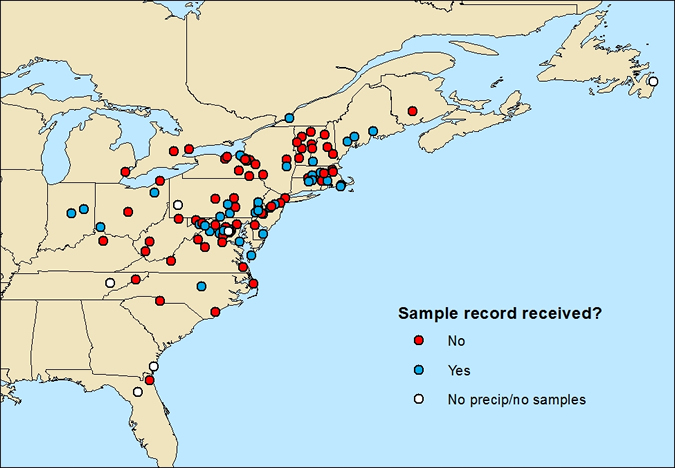
As incentive to turn-around your record sheets and samples we will be updating the map below daily, using symbols that indicate when we have received a record sheet or physical samples from each site in the network. You can see when your materials are recieved, or if you haven't yet gotten around to sending in your materials that will show, too! For those of you who are in areas that were hard-hit and where infrastructure is still recovering from the storm, please do take your time and take care of critical needs first...we will be able to incorporate your contributions when it works for you.
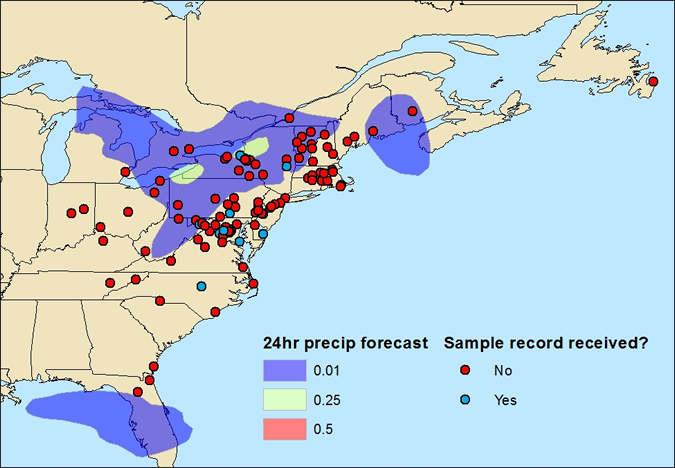
The remnants of Sandy are dissipating this morning, and for some of you the forecast suggests that you will not receive any additional precipitation from this system. That means it’s time to pack up your samples and send them in for analysis!
Other parts of our study region are still projected to receive addition storm-related precipitation (see the updated map below). If you are in one of these regions, we'd appreciate your continued effort to collect precipitation until the system has moved out of your area.
We will contacting known volunteers individually throughout the week based on their location, giving the 'go-ahead' to send in samples. If you are not on our email list, please use the precipitation forecast maps that will be updated here daily to determine if you are 'in the clear', and send in your samples at that point.
A summary of instructions for sample submission:
Many of our volunteers are flooded or without power this morning. We're all hope you're safe and wishing for a rapid recovery across the affected area.
The area receiving storm-related precipitation is vast, stretching from the East Coast to Michigan and Indiana and from South Carolina into Canada. We've had some recent additions to our network, now 120 strong, which help extend our coverage to the west to capture action toward the periphery of the storm.
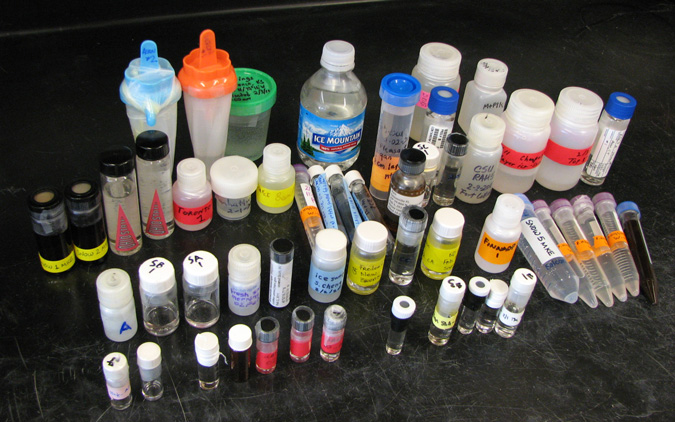
We've started receiving photos of samples and sampling sites and stories about unique and creative collecting apparatus. Feel free to email us images, we'll create and link up a public photo album if we receive a critical mass of photos.
For those of you scratching your heads about what to do with all those samples, perhaps you can draw some inspiration from the photo below, showing an array of unconventional sample containers we received in response to our 2011 Groundhog Day Blizzard sampling effort!
***12:30 EST, just logged our 100th known volunteer and updated map, thanks everyone!***
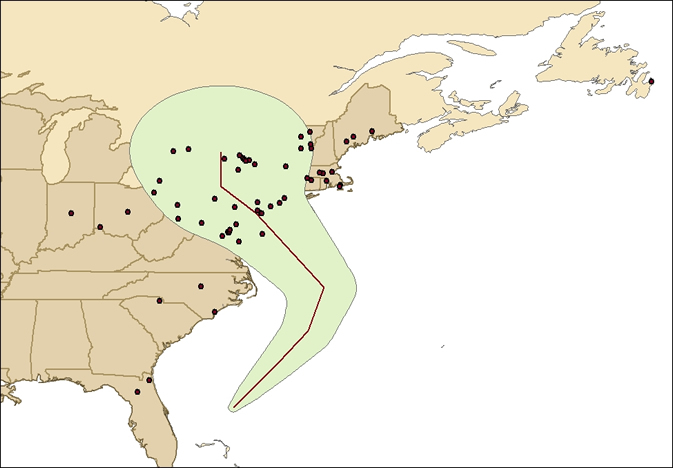
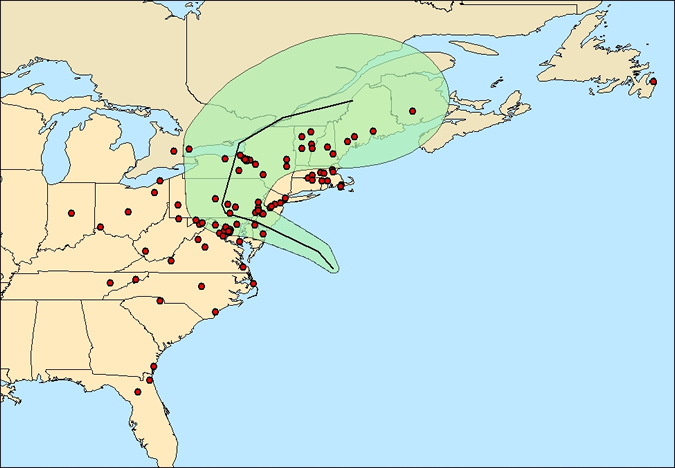
Hurricane Sandy has started to adjust its trajectory to the NNW and heavy rains look to have started for many of our volunteers in Virginia, DC, Maryland and New Jersey. Forecasts are also increasingly suggesting that our volunteers in Maine, New Brunswick, and Newfoundland will see significant effects from this storm later in the week. The most recent NHC 5-day projection and our updated sampling network have been posted below.
We are approaching 100 known volunteers in our network, and many of the gaps noted yesterday have been nicely filled (thanks everyone for your response!). Now it's up to you to make this happen. First and foremost, stay safe! If you told to evacuate, evacuate. If you are experiencing high and dangerous winds or flooding, don't worry about collecting that sample. If you have a safe opportunity, however, do your best to collect some quality rain samples that integrate the precipitation you receive over 12-hour periods in the coming days.
We've requested that everyone try to collected cumulateive precipitation samples between 8 am and 8 pm (and 8 pm and 8 am) each day. Why? Part our our goal is to track the evolution of water isotope ratios in the storm over time, and to do this we need a sequence of samples from individual sites and across the network. But another goal is to map the spatial distribution of isotope ratios to help us understand how different parts of the storm look at a given time. To do this, it helps if samples from different sites in the network integrate precipitation from common sampling periods.
Is it critical that you collect your sample from exactly 8 to 8? No. The 12-hour sampling period is long enough that it won't matter if you're off by a couple of minutes, or a couple of hours. What is very important, though, is to accurately record the time you started and stopped the collection of each sample in your sample record. This will ensure that we can critically evaluate the data we produce and treat each sample appropriately.
Lastly, some of you are receiving or will receive snow from the storm. You can collect snow in exactly the same way as you do rain. For snow collection, try to place your collector in an area where it is sheltered from drifting and strong winds, as this can cause sample loss or mixing of old and new snow. Also, try to bring your whole sample indoors and let it melt before puttin it in your storage container. This allows the melted water to mix and homogenize, giving us a representative sample and making sure we have enough water for our analysis.
Many of you are starting to receive precipitation, either from Sandy or from the approaching cold front. If you are receiving rain or snow from either system, please sample it! We are very interested in characterizing both systems and monitoring what happens as they converge.
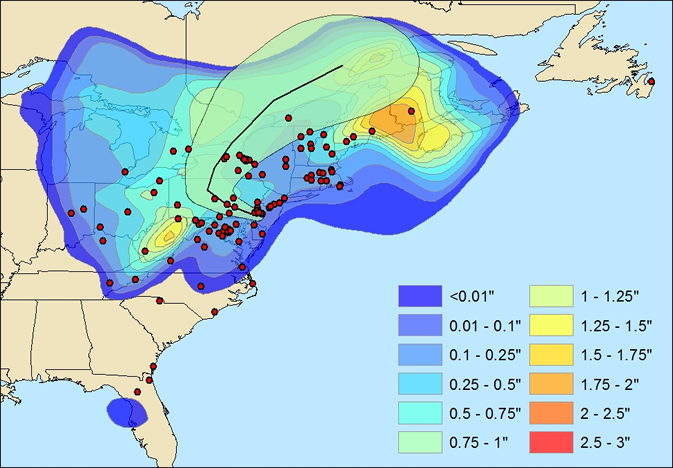
Below I've posted an updated sampling map also showing the most recent NHC trajectory predicitions as of 3 pm eastern time this morning. Also of interest, here is the most recent projection for 5-day precipitation totals!
Lastly, we have some gaps in the network of known contributors, particularly in West Virginia, Virginia, and eastern Kentucky/Tennesee that would be nice to fill. If you know any potential contributors from these areas please let them know about this effort!
Hurricane Sandy is currently moving northward along the East coast of the USA, and is expected to collide with a cold front and move inland across the northeastern USA during the next several days. On Friday we initated a call for assistance collecting samples of precipitation (both rain and snow) associated with the passage of this system. Our goal is to develop an unprecedented spatial and temporal dataset documenting the isotopic composition of rainwater (and snow) associated with this major storm system. Briefly, these data will tell us about water sources and cycling within the storm system - we are hoping to see evidence for changes in water sources to the storm as it first collides with the approaching cold front and then leaves the ocean to traverse the NE USA.
As of Saturday morning we have developed a network of more than 60 volunteers who will provide samples from across the region affected by the storm. We are asking contributors to collect cumulative precipitation samples for 12-hour periods (8 am - 8 pm; 8 pm - 8 am) throughout the storm's lifetime, allowing us to map the evolution of the storm's isotopic composition in space and time. At the end of the sampling period waters will be returned to the SPATIAL group at the University of Utah, where they will be analyzed for H and O stable isotope ratios. The data will be returned to the volunteers and in the near term will be posted to this site along with information and analysis.
If you are interested in collecting samples or know someone who might be, especially if you are located in an affected area not covered by our existing network (see below), please feel free to get in touch with us at gabe.bowen@utah.edu or just start collecting samples. Instructions can be found here. A spreadsheet to record sample information can be downloaded here. The short version: