


Hot off the presses - initial animations of H isotope ratios and deuterium excess. We are also working with our atmospheric science colleagues toward an iniatal quantitative analysis of relationships between circulation patterns and isotopic patterns...more to come soon!
Happy New Year everyone. I'm excited to report that the last of the isotope samples from Hurricane Sandy were analyzed in early Decemeber, we found some time over the holiday break to conduct quality checks, and we're now in the process of working up a set of preliminary analyses and reports.
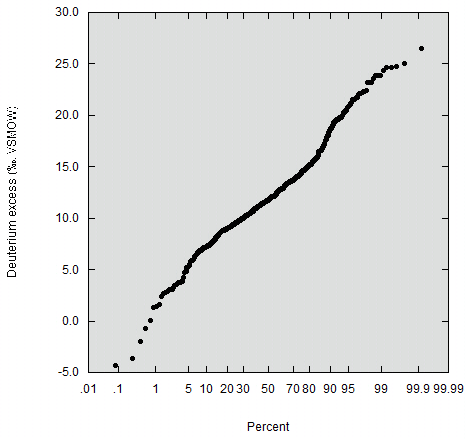
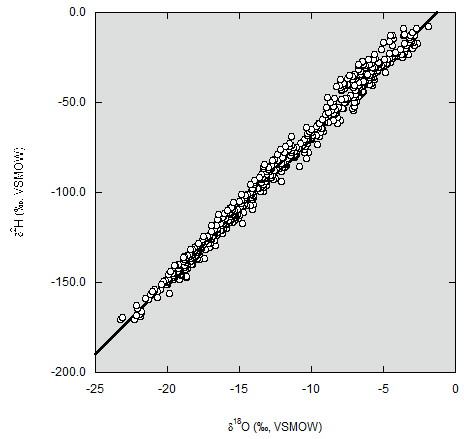
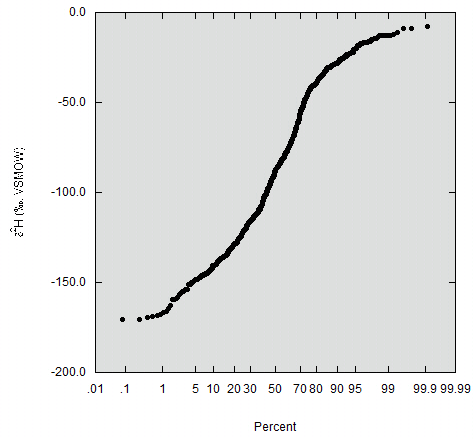
The graphs below will be familiar to those who spend time looking at water isotope data, and provide initial documentation of the full dataset. I spent some time earlier today working on a set of time-series plots and animations showing the spatiotemporal evolution of water isotopes in the storm, and will work to get these up on the site by the end of this week.
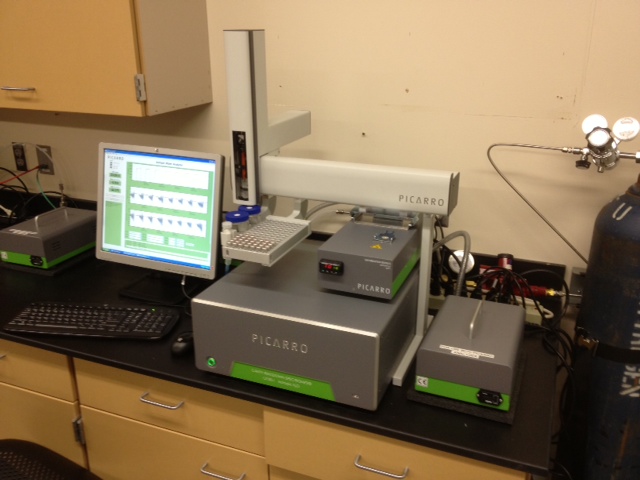
It's been some time since our last update...I've been traveling in Europe for a couple of workshops on isotopes and isoscapes, but back at the lab the instruments have been hard at work (thanks Yusuf, Crystal, and Dan!). In fact, we were so eager to work through the pile of samples we've been accumulating that we decided to go ahead and invest in some extra equipment that we were 'on the fence' about in order to increase our throughput. The good people at Picarro had it shipped to us within 48 hours, and it's installed, tested, and running its first samples today. We have analyzed more than 150 of the 600+ samples we have logged so far, and below I've posted some very preliminary results.
I will keep interpretation to a minimum for right now and just focus on the data. Two things stand out:
1) There is a huge range in values across the sample set we've analyzed. We saw this same result within the GHD storm we sampled in 2011, and others are seeing similarly large ranges of variation in storm water isotope ratios over time (e.g., see Penny Higgin's data for the passage of Sandy through Rochester, NY). The implication is that different parts of these large, organized systems exhibit big variations in water source and/or precipitation mechanisms (where and under what conditions condensate is being formed), and this is being nicely expressed in the isotope observations.
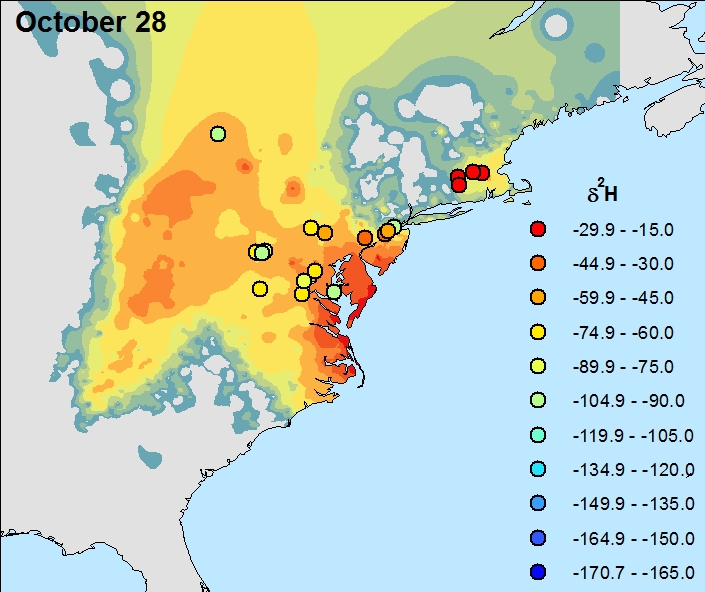
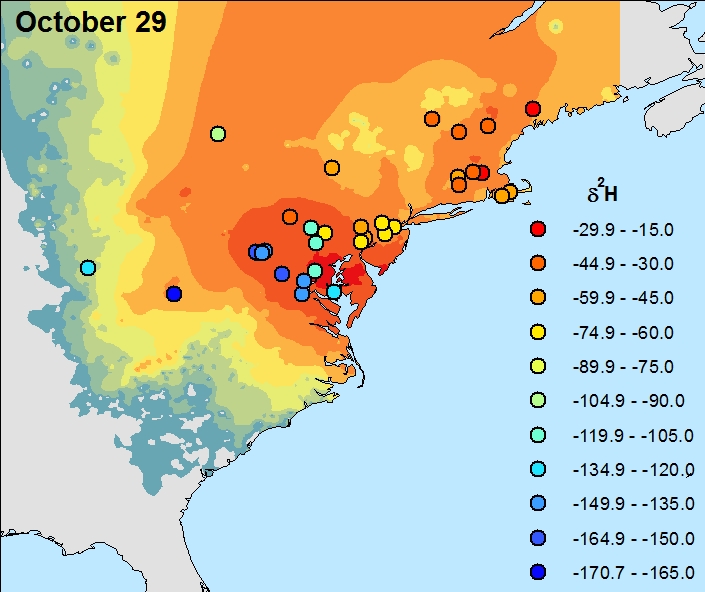
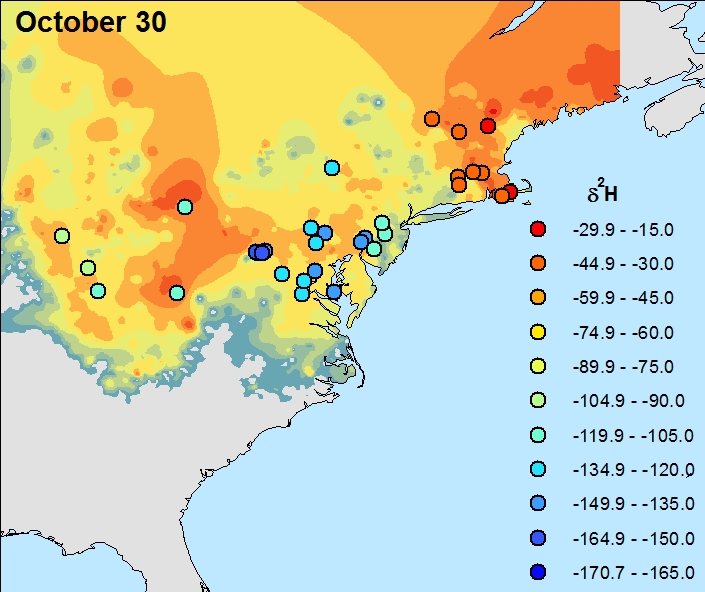
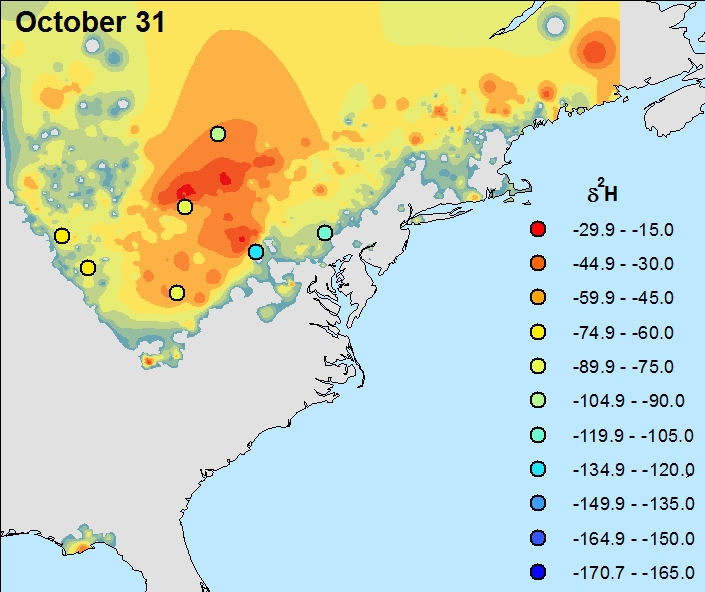
2) There is great spatial structure in the dataset. I haven't attempted to interpolate or grid these data to make a color map yet, and will wait until the dataset is more complete to say too much about it, but what strikes me is the strong asymmetry about the eye of the storm as it moved ashore on the 29th and 30th of October. We'll be following up on that observation in the coming weeks...
Initial H isotope ratio results for Sandy, averaged over 24-hour periods. The background color field is an interpolation of precipitation amount data from the COCORAHS citizen science network - please note that the patterns are good for the USA but there are very few sites in Canada, and the patterns there are largely meaningless.
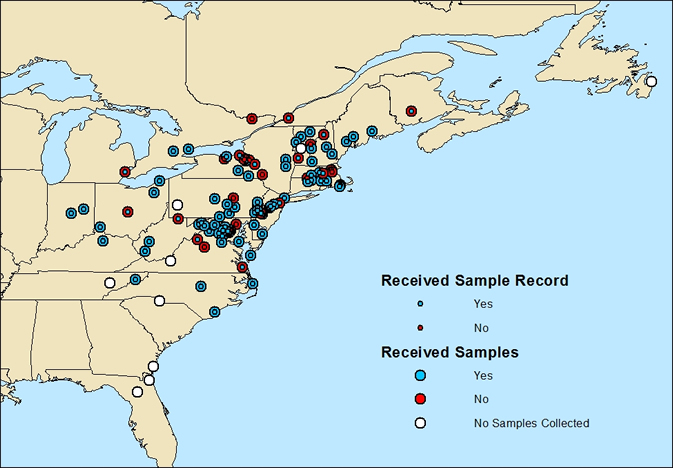
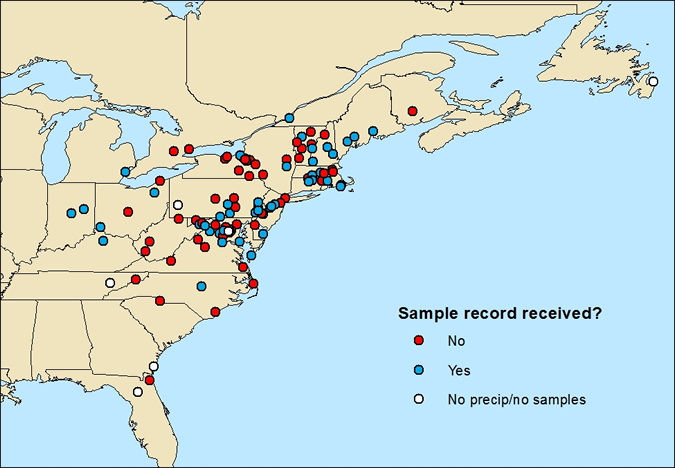
Lastly...because I promised it, here is the most recent installment of our "sampling map". We have struggled to keep this up to date with the flood of samples, so please don't be too worried if you don't see your samples or info on the map yet!
Hello everyone - today we've got a quick update on sample returns and a bit of information about what we'll be doing in the lab over the coming weeks...
As of this morning we have received sample record sheets from 59 participants, thank you! We will send out emails to the rest of the volunteers that we have on record today, just to get a sense for the status of your sampling effort. Please ignore this email until you have gone out and voted ;) then write us back and let us know if you will be providing samples.
And speaking of samples, this was the scene on our lab bench after the USPS delivery yesterday:
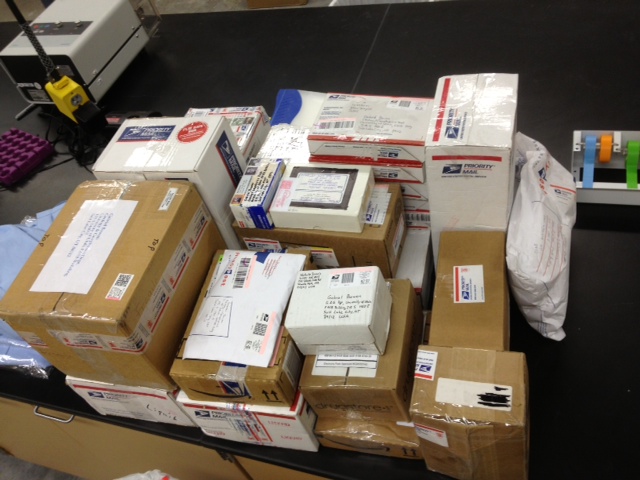
We have begun opening and logging all the samples in these boxes, which will take us a while! We should be ready to load the first samples for analysis tomorrow morning.
Our analytical goal is to obtain high-precision measurements of the hydrogen and oxygen isotope ratios of the samples you're providing. This effort is made possible by a new set of instruments in our lab - a cluster of Picarro 2130-i cavity ringdown spectrometers. Your samples will all be analyzed on one of these instruments that is configured for in-lab water isotope analysis. We have been running this instrument for about a month with excellent results so far (long-term external precision of 0.04 for O, 0.19 for H, for those of you who are isotope-inclined). In addition, it has lowered our cost of analysis by about a factor of 5 compared to the mass spectrometers we have been using previously, making larger 'exploratory' projects such as this one a possibility. We have several other CRDS water instruments in the lab which we are configuring for water isotope analysis in the field, so maybe next time we can bring the lab to the storm, rather than bringing the storm water to the lab!
Archived blog entries - read about the launch of the Sandy isotope sampling effort